
Portfolio benchmarking executive talent is the process of comparing leadership readiness and performance metrics across portfolio companies to predict value creation and guide strategic hiring decisions. HR professionals and executives who understand how portfolio benchmarking executive talent works gain a measurable edge over those relying on gut instinct or narrative succession plans. The methodology integrates structured assessments, leadership KPIs, and cross-company comparison to expose talent gaps before they become financial risks. Firms that link talent KPIs to investment outcomes treat leadership as a quantifiable driver of enterprise value, not a soft variable.
How portfolio benchmarking executive talent works: the core mechanics
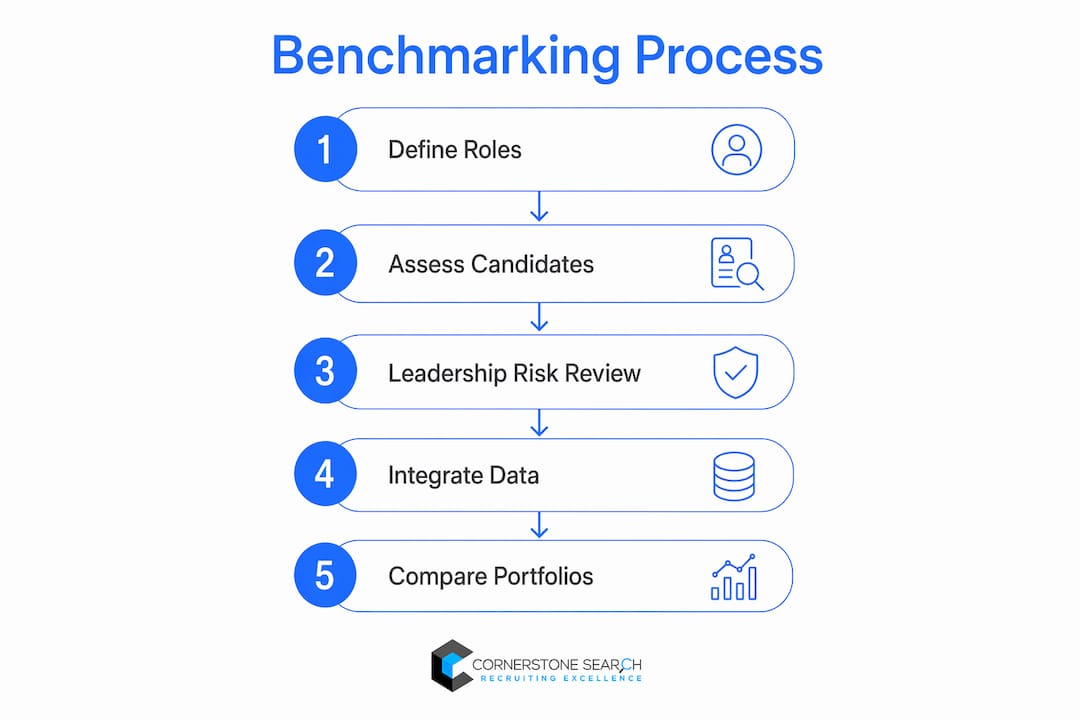
Portfolio benchmarking for executive talent works by defining critical roles first, then scoring each candidate or incumbent against the requirements of the target seat, not the seat they currently occupy. This distinction matters because it forces evaluators to assess future readiness rather than past performance. The methodology typically uses a 0-10 scale across five components: functional expertise, scope of leadership, stakeholder credibility, strategic context, and cultural alignment.
The process begins with a leadership risk review that maps every critical role across portfolio companies and assigns successor readiness categories. Readiness bands like “Ready Now” give boards a clear, defensible view of succession depth rather than a list of names that provides false confidence. The output is a governance artifact, not a one-time exercise. It gets updated quarterly and presented at the board level alongside financial metrics.

What separates mature programs from basic succession planning is the integration of talent data with investment thesis milestones. A portfolio company approaching a Series C raise or a PE-backed firm targeting an exit in 18 months needs different leadership readiness than one in steady-state operations. Benchmarking calibrates that context explicitly.
What KPIs actually predict leadership value creation?
Board-level talent KPIs that are directly linked to execution discipline and leadership alignment are stronger predictors of value creation than any qualitative leadership narrative. This means the metrics you track must connect to financial outcomes like IRR, exit multiples, and revenue delivery velocity. The following KPIs form the core of a credible portfolio benchmarking system:
- Succession depth: The number of qualified, validated successors per critical role. Mature programs target two to three successors per seat, not just named candidates.
- Time-to-fill for critical roles: Extended vacancies in VP-level and above positions directly correlate with execution delays and missed milestones.
- Retention rate of high-potential leaders: Losing a top-quartile executive mid-hold period is a material risk event, not an HR inconvenience.
- Bench strength index: A composite score measuring the percentage of critical roles with at least one “Ready Now” successor.
- Leadership productivity metrics: Output per leader measured against sector cohort medians, tied to revenue per employee or pipeline generation rates.
Succession depth and retention are the two indicators most frequently underreported because firms confuse coverage (having a name on a list) with depth (having a validated, scored candidate). A program that tracks both separately avoids the false confidence that sinks succession plans when a key executive departs unexpectedly.
Pro Tip: Build a single-page talent scorecard for each portfolio company that shows succession depth, bench strength, and time-to-fill side by side with EBITDA and revenue growth. When talent and financial data share the same page, boards stop treating leadership risk as a separate conversation.
How do structured assessments improve benchmarking accuracy?
Unstructured interviews are the single biggest source of error in executive hiring and benchmarking. Structured assessments incorporating behavioral interviews, psychometrics, and business simulations reduce hiring failure rates from roughly 50% to between 80% and 95%. That gap represents the difference between a leadership team that executes and one that stalls a portfolio company’s growth trajectory.
Structured executive assessment for benchmarking purposes typically includes three layers. The first is a behavioral interview anchored to the five readiness components described earlier. The second is a psychometric profile that measures cognitive style, risk tolerance, and interpersonal influence patterns. The third is a business simulation, such as a 90-day plan presentation or a P&L case study, that tests how a candidate actually thinks under conditions close to the role they would fill.
The simulation layer is where most firms underinvest. A candidate who can articulate a compelling vision in an interview but cannot produce a credible 90-day operating plan for a $40M SaaS business is not ready for a VP of Sales or COO seat, regardless of their resume. The simulation surfaces that gap in a way no reference check or interview can replicate.
Pro Tip: When benchmarking internal candidates against external ones, use identical simulation exercises for both groups. This removes the familiarity bias that inflates internal candidate scores and gives you a true apples-to-apples comparison.
The biggest risk in executive hiring is relying on unstructured inputs. Standardizing the evaluation toolkit across all portfolio companies is what transforms benchmarking from a subjective exercise into a repeatable, defensible process.
What frameworks support readiness scoring and succession planning?
The 9-box talent review framework is the most widely used tool for mapping performance against potential across a leadership population. It separates the two dimensions on a 3×3 matrix, producing nine categories that range from low performance and low potential to high performance and high potential. The 9-box framework aids succession and development planning by linking each category to a specific development focus, from performance management to accelerated leadership tracks.
The critical practitioner mistake is conflating the 9-box review with the succession planning grid. They serve different purposes. The 9-box tells you who has potential. The succession grid tells you who is ready for a specific seat. Using them sequentially, rather than interchangeably, produces sharper decisions and avoids promoting high-potential leaders into roles they are not yet equipped to fill.
The table below shows how readiness categories map to scoring bands and recommended actions:
| Readiness category | Score range (0-10) | Recommended action |
|---|---|---|
| Ready Now | 8-10 | Activate succession plan; begin transition preparation |
| Ready in 12-18 months | 5-7 | Assign stretch projects; close identified gaps |
| Not Ready (developmental) | 3-4 | Structured development plan with 24-month horizon |
| Not Ready (role mismatch) | 0-2 | Reassign or exit; initiate external search |
Component-level readiness scoring against explicit seat dimensions reduces halo and bias effects that occur when evaluators over-weight tenure or personal charisma. Setting hard red lines for each readiness component, for example, requiring a minimum score of 6 on stakeholder credibility for any CFO candidate, prevents a strong score in one area from masking a critical gap in another.
Pro Tip: Run calibration sessions with two or three independent raters before finalizing readiness scores. Calibration meetings reduce manager bias and surface disagreements that, when resolved, produce more accurate and defensible assessments.
How cross-portfolio comparison surfaces risk and optimizes value
Cross-portfolio benchmarking compares leadership indicators across similar portfolio companies at a point in time, then tracks movement against peer medians and sector cohorts over successive quarters. This is where individual company assessments become a portfolio-level risk management tool. An operating partner who can see that three of seven portfolio companies have zero “Ready Now” successors for their CEO seat is looking at a material risk concentration, not three separate HR issues.
Dashboard design determines whether this data gets used or ignored. Effective portfolio dashboards limit key metrics to 8 to 10 stable indicators per company for managing director views, reserving operational depth for embedded partners. Overloading a board-level dashboard with 30 metrics produces the same outcome as showing zero: no decision gets made.
The table below illustrates a cross-portfolio talent risk snapshot format:
| Portfolio company | Succession coverage | Bench strength index | Avg. time-to-fill (days) | Risk flag |
|---|---|---|---|---|
| Company A | 85% | High | 34 | None |
| Company B | 60% | Medium | 67 | Time-to-fill |
| Company C | 40% | Low | 91 | Coverage + speed |
| Company D | 90% | High | 28 | None |
Company C in this snapshot is not just an HR problem. It is a value creation risk that an operating partner needs to address before the next board meeting. The benchmarking system makes that visible in a format that drives action rather than discussion.
Coverage ratios without validation expose firms to risk when a key departure occurs. Tracking bench depth alongside bench coverage, meaning validated and scored successors rather than just named ones, is the standard that separates mature programs from checkbox exercises.
Key takeaways
Portfolio benchmarking executive talent works when leadership readiness is scored against target roles, validated through structured assessment, and tracked as a financial risk metric alongside IRR and exit timelines.
| Point | Details |
|---|---|
| Score against the target seat | Assess candidates on the role they will fill, not the one they currently hold, using a 0-10 component scale. |
| Link talent KPIs to financial outcomes | Track succession depth, time-to-fill, and bench strength alongside IRR and revenue metrics for board-level decisions. |
| Use structured assessments | Behavioral interviews, psychometrics, and simulations reduce hiring failure rates from 50% to 80-95%. |
| Separate bench coverage from bench depth | Named successors without validation create false confidence; require scored, validated candidates per critical role. |
| Design dashboards for the audience | Limit managing director views to 8-10 stable metrics; reserve operational detail for embedded operating partners. |
Why most firms are still doing this wrong
I have spent nearly three decades placing sales and executive talent inside SaaS and software companies, and the pattern I see most often is this: firms invest in succession planning documents and then treat them as static artifacts. They name successors, file the plan, and revisit it annually if at all. That is not benchmarking. That is record-keeping.
The firms that actually use this process to create value are the ones that treat readiness scores the same way they treat revenue forecasts: updated quarterly, challenged by multiple stakeholders, and tied to a specific decision or action. When a portfolio company’s VP of Sales has a readiness score of 4 for the CRO seat and the investment thesis requires a CRO in place before a Series C close, that score triggers an external search immediately. Not a development plan. Not a wait-and-see. A search.
The other mistake I see consistently is over-relying on charisma and tenure when scoring internal candidates. A leader who has been with a company for six years and presents well in a board meeting will consistently score higher than a less familiar candidate with stronger functional credentials, unless you use component-level scoring with explicit red lines. The framework is not bureaucracy. It is the mechanism that keeps bias out of decisions that directly affect enterprise value.
The firms getting this right are treating talent benchmarking as a governance discipline, not an HR deliverable. That shift in ownership changes everything about how the data gets used.
— Rich Rosen
How Cornerstonesearch supports executive benchmarking for portfolio companies
Cornerstonesearch has placed over 1,200 sales and executive professionals since 1996, with an average time from search kickoff to offer acceptance of just 21 days. For portfolio companies that need to fill a critical leadership seat quickly and accurately, that speed matters as much as the quality of the candidate. Cornerstonesearch’s methodology aligns directly with structured benchmarking processes: every search begins with a precise role definition, and every candidate is evaluated against the specific seat requirements of your portfolio company, not a generic job description.
Whether you are managing executive search for a VC-backed startup or filling a critical sales leadership role across a SaaS portfolio, Cornerstonesearch’s talent acquisition consulting and executive search services are built to integrate with your benchmarking framework and deliver candidates who move your readiness scores in the right direction.
FAQ
What is portfolio benchmarking for executive talent?
Portfolio benchmarking for executive talent is the process of measuring leadership readiness, succession depth, and performance KPIs across multiple portfolio companies to identify talent risks and optimize hiring decisions. It links leadership metrics directly to financial outcomes like IRR and exit multiples.
How do you score executive readiness in a benchmarking system?
Executive readiness is scored on a 0-10 scale across five components: functional expertise, scope, stakeholder credibility, strategic context, and cultural alignment. Candidates are scored against the target role, not their current position, with readiness bands like “Ready Now” or “Ready in 12-18 months” assigned based on total scores.
What is the difference between bench coverage and bench depth?
Bench coverage refers to having named successors for critical roles, while bench depth means those successors are validated, scored, and genuinely qualified. Mature programs target two to three validated successors per critical role to avoid the false confidence that comes from coverage without qualification.
Why do structured assessments matter for executive benchmarking?
Structured assessments incorporating behavioral interviews, psychometrics, and business simulations reduce executive hiring failure rates from approximately 50% to between 80% and 95%. Standardizing these tools across portfolio companies makes benchmarking comparisons accurate and defensible rather than subjective.
How many KPIs should a portfolio talent dashboard track?
Portfolio talent dashboards for managing directors should track 8 to 10 stable indicators per company, including succession coverage, bench strength, and time-to-fill. Operational detail is reserved for embedded operating partners who need deeper data to manage day-to-day talent decisions.