

Your headcount number is a lie until you run it through ramp, attainment, and attrition. If effective capacity falls short of the revenue target, the fix is never “hire faster.” Pull your cohort ramp data, your last two quarters of attainment, and your rep attrition rate, then run a bottoms-up capacity check before you touch the hiring plan. Nine times out of ten, the real problem is timing, not headcount.
TL;DR:
- Rely on bottoms-up, cohort-specific ramp data, attainment rates, and attrition models rather than simple headcount or industry averages for accurate capacity planning.
- Ignoring pipeline coverage and territory potential leads to overestimating effective capacity and increases the risk of missing revenue targets despite adequate staffing.
- Front-load hiring efforts and factor in sales cycle length and seasonality to ensure reps are fully ramped before peak periods and avoid capacity gaps during slow quarters.
- Continuous model updates are essential, as market shifts, attrition, and ramp performance vary, making monthly re-evaluation crucial for reliable forecasts.
- Engaging specialized recruiters early can significantly reduce time-to-hire, enabling faster ramping and closing capacity gaps before they impact revenue.
Table of Contents
- What Is Sales Capacity Planning?
- Why It Matters: Costs And Risks Of Naive Planning
- Core Inputs And Metrics To Feed The Model
- How Do You Build A Monthly Capacity Model?
- Sample Calculation: The Attrition-Adjusted Capacity Formula
- Common Mistakes And Quick Sanity Checks
- Cornerstone And Rich Rosen: Hiring Practice That Moves Capacity Numbers
- How Do You Factor Territory Potential Into Capacity Planning?
- Adjusting Capacity Plans For Sales Cycle Length And Seasonality
- How Does Sales Enablement Connect To Capacity Planning?
- How Do You Keep A Capacity Plan Current?
- Do Different Sales Roles Need Different Capacity Models?
- How Do You Balance Capacity Plans With Budget Reality?
- Rich Rosen’s 90-Day Checklist
- When To Bring In A Recruiter: The Cornerstone Alternative
- Sources
What Is Sales Capacity Planning?
Sales capacity planning is the process of figuring out how much revenue your sales team can actually produce, then comparing that number to what the business needs. Not what your org chart says you can produce. What you can actually produce.
Here’s the gap that kills plans: paper capacity versus effective capacity. Paper capacity is headcount times quota. Ten reps, $1 million quota each, equals $10 million. Sounds great. Effective capacity is what those ten reps deliver once you account for ramp time, real attainment, and the reps who quit halfway through the year. That number is almost always smaller, sometimes a lot smaller.
The difference between headcount, productive capacity, and revenue output matters because each one lies to you in a different way:
- Headcount tells you who’s on payroll, nothing about output.
- Productive capacity tells you how much selling time and skill is actually deployed.
- Revenue output is the only number the board cares about, and it’s the last one to show up.
That’s why bottoms-up, rep-level math beats top-down division every time. You build capacity from the ground up: rep by rep, cohort by cohort, then reconcile it against the top-down target finance handed you. If the two numbers don’t match, you’ve found your real planning problem before it becomes a missed quarter.
Why It Matters: Costs And Risks Of Naive Planning
Bad capacity math doesn’t just create an awkward board slide. It creates a hiring plan that’s wrong by design, and wrong hiring plans cost real money. A late senior hire can cost you a full selling season. A rep hired six months too late doesn’t just miss six months of quota, they miss ramp time on top of it, which pushes full productivity into next year.
Here’s the number that should scare every VP of Sales into checking their math: median quota attainment across many SaaS samples sits around 43%. If you’re modeling capacity assuming reps hit 100% of quota, you’re overstating your team’s output by more than double. That’s not a rounding error. That’s the difference between hitting the number and explaining to your board why you didn’t.
Pipeline coverage and territory design compound the problem. A rep can be fully ramped, fully staffed, and still miss quota because their territory doesn’t have enough pipeline to convert. Headcount math that ignores coverage ratios is just a guess dressed up in a spreadsheet.
Core Inputs And Metrics To Feed The Model
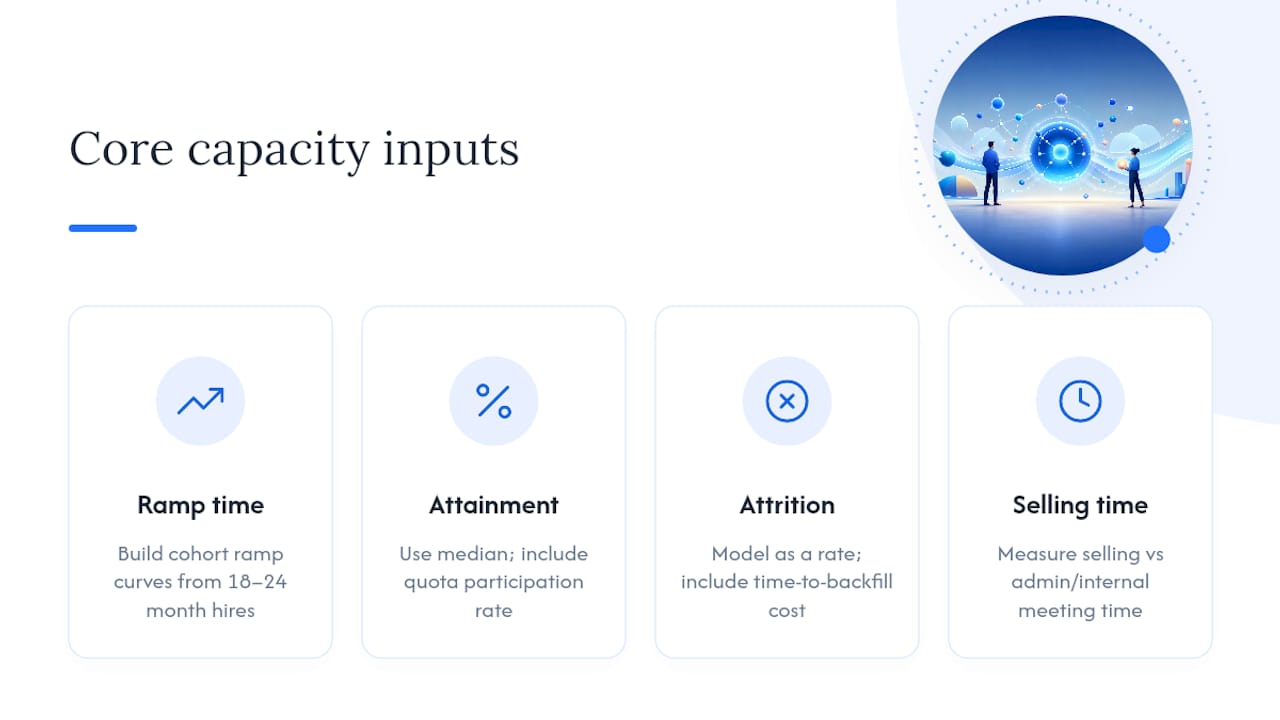
Your capacity model is only as good as the inputs you feed it. Generic benchmarks get you in the ballpark. Your own cohort data gets you the truth.
Start with ramp time. Build ramp curves from your own hire cohorts, not industry averages. Pull CRM and HRIS data on every rep hired in the last 18 to 24 months, then chart their monthly productivity against the cohort median. A rep is “ramped” when their trailing output matches what fully productive reps in that same segment produce. Segment ramp curves by role and deal complexity: an SMB AE ramps faster than an enterprise AE selling a six-month cycle, and modeling them the same way wrecks your accuracy.
Next, attainment and quota participation. Use the median, not the mean. A couple of top performers can make your whole team look healthy while the actual middle of the pack is underwater. Combine that with quota participation rate, meaning what share of your headcount is actually quota-carrying versus ramping, on leave, or in a role that doesn’t carry a number.
Then there’s attrition. Model it as a rate, not a footnote. Every departure costs you lost production before the exit, time-to-backfill after it, and a fresh ramp curve once the replacement starts.
Finally, check selling time versus non-selling work. A rep buried in admin and internal meetings isn’t delivering the capacity your model assumes, no matter how good their ramp curve looks on paper.
Pro Tip: Run your ramp curves by segment before you touch attainment numbers. If you blend SMB and enterprise ramp into one curve, you’ll systematically over-hire for one segment and under-hire for the other, and you won’t know which until it’s too late to fix.
How Do You Build A Monthly Capacity Model?
Here’s the actual workflow. No theory, just the steps.
-
Pull clean CRM and HRIS data. Get hire dates, quota assignments, monthly bookings, and termination dates for every rep over the last two years. If your data is messy, fix that first. A capacity model built on garbage inputs is worse than no model at all.
-
Build ramp curves by cohort. Group reps by hire quarter and segment. Chart month-by-month production as a fraction of full quota. Most SaaS ramp curves run somewhere between four and nine months depending on deal complexity, but don’t guess. Pull your own numbers.
-
Apply attainment to ramp fractions. Once you know a rep is producing, say, 70% of full capacity in month six, multiply that by your segment’s median attainment rate, not 100%. This is where most models fall apart. They ramp correctly then assume perfect attainment once ramped.
-
Layer in attrition and time-to-backfill. Effective capacity is a bottoms-up construct: total reps times ramped fraction times expected attainment times (1 minus turnover rate). This formula, laid out clearly by Ziellab’s capacity guide, is the backbone of every credible model. Add your average time-to-backfill on top of it, because an open seat produces zero revenue while it sits empty.
-
Compare monthly effective capacity to your monthly target. This is the reconciliation step. Line up your bottoms-up number against the top-down target finance set. The gap between them, month by month, tells you exactly when you’re short and by how much.
-
Convert the gap into hires needed by month, then work backward to sourcing start dates. If you need three incremental reps productive by Q3, and ramp takes five months, and recruiting lead time runs another two to three months for a quality SaaS AE, you needed to start sourcing back in Q4 of last year. Most companies figure this out in March and wonder why they’re still short in September.
Pro Tip: Front-load your hiring. Reps hired in January deliver far more in-year capacity than reps hired in July, purely because of ramp math. Two reps hired in Q1 will often out-produce three reps hired in Q3, and the timing gap is bigger than most planners assume.
Sample Calculation: The Attrition-Adjusted Capacity Formula
Numbers make this real. Here’s a compact worked example for a small SaaS sales org.
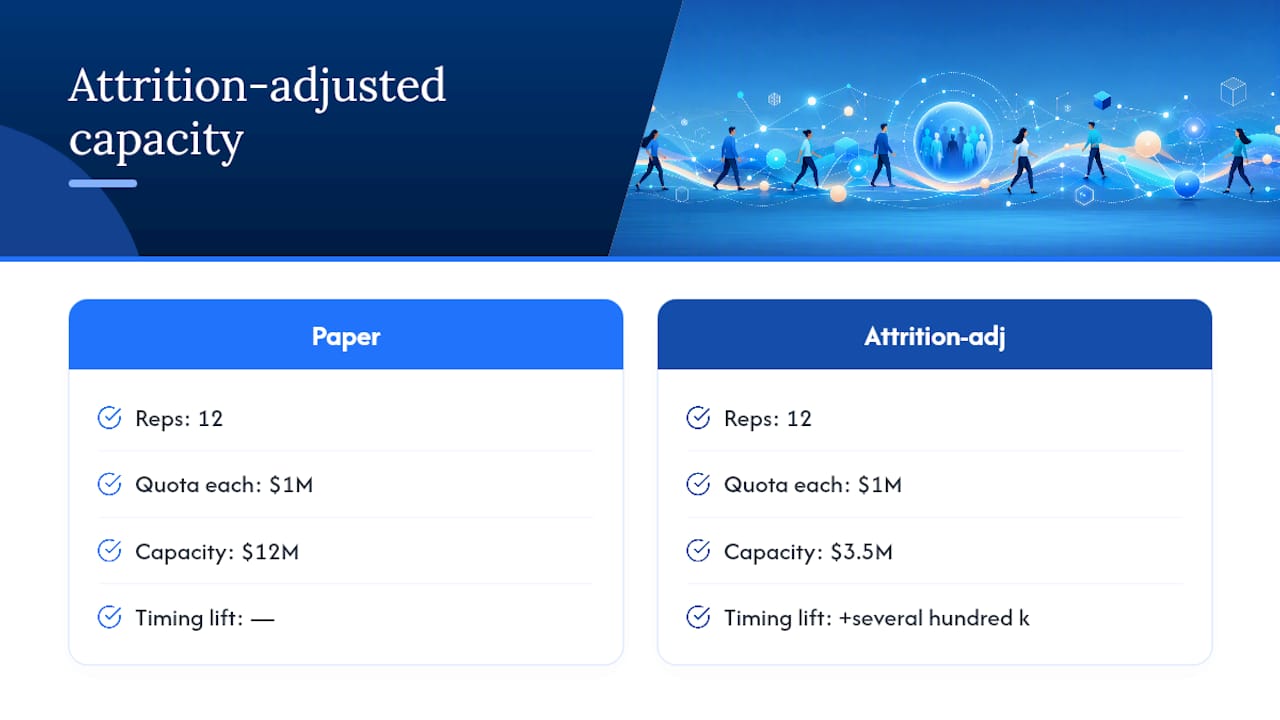
Say you have 12 reps carrying quota, fully ramped, at a $1 million annual quota each. Paper capacity looks like $12 million. Now apply the attrition-adjusted capacity formula: total reps times ramp fraction times attainment times (1 minus attrition).
That $3.5 million effective number against a $12 million paper number is not a typo. It’s why ignoring ramp and attrition typically overstates capacity by 15 to 25 percent at minimum, and in teams with high turnover, the gap runs much wider than that.
Now shift two of those hires from a Q3 start to a Q1 start. Because ramp curves are front-loaded into the model, those two reps alone can add several hundred thousand dollars of effective capacity within the same fiscal year, without adding a single extra headcount. Timing is not a minor variable in this model. It’s often the single biggest lever you control.
Common Mistakes And Quick Sanity Checks
Most bad capacity plans share the same handful of sins.
- Naive division: taking your revenue target and dividing it by average quota per rep. This ignores ramp, attainment, and attrition entirely, and it’s the single most common mistake in this business.
- Averages masking ramp problems: a blended team average can hide a struggling cohort of new hires underperforming the median at their milestone month, a pattern easy to catch if you’re actually comparing cohorts instead of one big number.
- Ignoring pipeline coverage: fully staffed and fully ramped means nothing if territories don’t have enough qualified pipeline to convert into bookings.
Run these three checks in the next five minutes: pull your last two quarters of median (not average) attainment by segment, compare your newest cohort’s month-three output against last year’s cohort at the same milestone, and check whether your open pipeline coverage ratio actually supports the quota you’ve assigned. If any of those three come back ugly, you’ve got real work to do, not a hiring problem to throw money at.
The management myths that quietly derail scaling companies almost always trace back to leaders trusting a plan they never stress-tested. Redo the bottoms-up math, adjust quota to match reality, or accelerate hiring. Pick one. Don’t just hope the number fixes itself.
Cornerstone And Rich Rosen: Hiring Practice That Moves Capacity Numbers
I’ve placed over 1,200 sales, presales, and executive candidates since 1996. Here’s what nobody tells you about capacity models: the model is only as good as your ability to actually execute the hiring plan it spits out.
A faster, higher-quality search shortens time-to-backfill, which is the single input in the attrition-adjusted formula most leaders underestimate. A specialized search partner can reduce time from search kickoff to offer acceptance. That’s not a brag line, that’s a direct input into your capacity model. Every week you shave off time-to-hire is a week of ramp you get back.
If you work with recruiting partners to close a gap, hold them to a short checklist: do they understand your segment’s deal complexity, can they source passive candidates instead of just posting a job, and can they move fast without dropping candidate quality. A slow search wrecks your model just as badly as a bad hire does.
How Do You Factor Territory Potential Into Capacity Planning?
A capacity model that ignores market and territory potential is just headcount math dressed up in Greek letters. You can have the perfectly ramped, perfectly staffed team and still miss the number if you’ve pointed reps at territories with no addressable demand.
Start by sizing total addressable accounts per territory, not just total accounts. A territory with 200 named accounts sounds generous until you realize 150 of them are too small to ever hit a $1 million quota. Segment territories by realistic revenue potential, not geography or alphabetical assignment, which is still how some companies do it in 2026 and wonder why half their reps miss.
Cross-reference territory potential against your pipeline coverage ratio. A rep with a great territory but thin pipeline coverage is a capacity risk hiding behind a good assignment. A rep with a mediocre territory but strong coverage might outproduce them anyway. Your capacity model needs both variables, not just headcount times quota.
This matters most when you’re deciding where to place new hires. If you’re adding three reps next quarter, don’t just split existing territories evenly. Put new capacity where the market potential actually supports another full quota, and consider whether an underperforming existing territory needs to shrink before you add a body to it. Growth doesn’t fix a territory that was never big enough to support the quota assigned to it.
Adjusting Capacity Plans For Sales Cycle Length And Seasonality
Sales cycle length changes everything about your hiring timeline, and most models treat it as an afterthought. A rep selling a 30-day transactional deal ramps and produces fast. A rep selling a nine-month enterprise deal can look “ramped” on activity metrics for months before a single closed deal shows up in the pipeline.
That gap creates a dangerous illusion. If your model assumes a four-month ramp but your actual sales cycle runs seven months, you’ll conclude a new hire is underperforming when they’re actually right on pace for the deal size they’re selling. Build your ramp curve length around your median sales cycle, segmented by deal type, not a company-wide average that blends fast SMB deals with slow enterprise ones.
Seasonality is the other variable planners forget until it bites them. If your business has a heavy Q4 close pattern, or a summer slowdown because half your buyers are on vacation, your monthly effective capacity isn’t flat across the year, it’s lumpy. A capacity model that assumes even monthly output across twelve months will systematically underpredict your best quarter and overpredict your worst one.
The fix is simple but rarely done: build seasonality factors into your monthly target, not just your annual one. If Q4 historically delivers 35% of annual bookings, your capacity model needs to reflect reps carrying heavier effective load in that window, and your hiring timeline needs to have those reps fully ramped well before Q4 starts, not during it.
How Does Sales Enablement Connect To Capacity Planning?
Enablement and training aren’t a soft, feel-good add-on to your capacity plan. They’re the mechanism that determines how fast a rep moves from zero to full ramp fraction, which means enablement quality is directly baked into the ramp curve you built in your model.
A rep who gets a strong 30/60/90 onboarding plan, real product training, and structured pipeline coaching in their first quarter will typically hit the cohort median faster than one thrown a laptop and a CRM login. If your ramp curve shows new hires taking nine months to reach full productivity and a competitor’s comparable team ramps in five, the gap usually isn’t talent. It’s the training program, or the lack of one.
This is also where capacity planning and enablement investment should be a two-way conversation. If finance is pushing you to shorten your modeled ramp time to hit a tighter hiring budget, the honest response is: show me the enablement investment that would actually make that ramp curve shrink. You can’t demand a faster ramp on a spreadsheet without funding the training that produces it in real life.
Track ramp curve improvements after any major enablement change. If you roll out a new certification program or overhaul your sales methodology, measure whether the next hire cohort ramps faster than the last one. That’s the only honest way to know if your enablement spend is actually buying you capacity, or just buying you a nicer onboarding deck.
How Do You Keep A Capacity Plan Current?
A capacity model built once a year and never touched again is worse than useless, it’s actively misleading by month four. Markets shift, reps quit, deals slip, and your ramp curves change as your product and buyer change too.
Set a monthly cadence to re-check your three core inputs: actual attainment against modeled attainment, actual ramp progress for any cohort still climbing, and actual attrition against your modeled rate. If any one of those three drifts more than a small margin from your assumption, that’s your signal to rerun the model, not wait for the quarterly business review to surface it.
Build a simple variance report that compares modeled effective capacity to actual delivered capacity, updated monthly. This is also the exact artifact worth bringing into a structured quarterly business review with finance, because it turns “we missed the number” into “here’s exactly which input drove the miss, and here’s the adjustment.”
The teams that get burned aren’t the ones with imperfect models. They’re the ones who built a good model in January and never opened the spreadsheet again until the year fell apart in October.
Do Different Sales Roles Need Different Capacity Models?
Treating every quota-carrying role the same is one of the fastest ways to build a broken model. An SDR generating pipeline, an AE closing deals, and a Sales Engineer supporting technical evaluations all have completely different relationships to “capacity.”
For AEs, capacity planning follows the model outlined throughout this piece: ramp, attainment, attrition, all pointed at closed revenue. For SDRs, capacity is better measured in qualified meetings or pipeline generated, not bookings, and their ramp curve is usually shorter since the skill ceiling for outbound prospecting is lower than complex deal closing.
Sales Engineers and other technical presales roles complicate the math further because their capacity isn’t measured in a personal quota at all, it’s measured in deal coverage ratio: how many AE deals can one SE support without becoming the bottleneck. If you’re scaling AE headcount without scaling SE capacity in parallel, you’ll hit a ceiling where deals stall in technical evaluation regardless of how many quota-carrying reps you’ve hired.
Specialization within the AE role matters too. An enterprise AE selling complex, multi-stakeholder deals needs a longer ramp curve and different attainment benchmarks than a mid-market AE running a faster, more transactional motion. Segment your capacity model by role and specialization from the start, because a single blended number across your whole go-to-market org will always be wrong for somebody.
How Do You Balance Capacity Plans With Budget Reality?
Every capacity model eventually collides with a budget number, and the honest truth is you can’t always hire your way to the ideal effective capacity your model says you need. That’s not a planning failure, that’s business reality, and the model’s job here is to make the tradeoff visible instead of hidden.
When budget constrains headcount, you have three real levers, not one. You can extend your timeline and accept the revenue target slips. You can invest in ramp acceleration through enablement to get more effective capacity out of the same headcount. Or you can reallocate existing capacity toward higher potential territories instead of spreading it evenly.
Cost optimization in capacity planning isn’t about hiring cheaper reps. It’s about sequencing hires so each incremental rep produces the maximum effective capacity for the dollars spent. A rep hired in January who ramps into a high potential territory will almost always deliver more return per dollar than two reps hired in Q3 into thin territories, even if the January hire costs more in base salary.
The conversation with finance goes better when you bring the model instead of a headcount ask. Showing effective capacity by month against target, with the budget tradeoffs laid out plainly, turns a fight over headcount into a shared decision about which lever to pull. That’s a much easier conversation than defending a number nobody can see the math behind.
Rich Rosen’s 90-Day Checklist
If I were running your capacity plan next quarter, here’s the order I’d move in. First, validate your data. Pull real ramp and attrition numbers from your own CRM and HRIS, not industry benchmarks. Second, run the scenarios. Model best case, base case, and worst case attrition, then see how far apart your hire schedules actually land.
Third, if the gap is real, start sourcing now, not after the board meeting where you promise to “fix it.” The blunt truth: a capacity gap discovered in Q3 was created in Q1, and pretending otherwise just pushes the miss into next year. Fix your inputs first. The hiring plan follows the math, not the other way around.
— Rich Rosen
When To Bring In A Recruiter: The Cornerstone Alternative
When your bottoms-up model shows a real gap and your internal recruiting can’t move fast enough, that’s the exact moment a specialized search partner changes your outcome. Cornerstonesearch exists for that gap: SaaS and software companies that need senior sales, presales, or executive hires placed with speed and precision, not another generic req sitting open for months while your capacity number bleeds red.
Time-to-hire is a direct input in your capacity formula, and an experienced recruiter can place sales professionals with speed that shortens the backfill gap your attrition-adjusted formula punishes you for every single month a seat sits empty. For senior or specialized roles, a network built specifically around SaaS sales talent gets you candidates general job boards never surface.
If your model just told you that you need a VP of Sales, a CRO, or a senior AE cohort ramped and producing by a specific month, work backward from that date and start the conversation early. Explore Cornerstone’s software sales recruiting services or review sales recruitment fundamentals for building a winning team to see how a search actually runs before your gap gets any bigger.