

Your operating dashboard should track seven metrics this week: pipeline coverage ratio, win rate (SQL to closed-won), average deal size, sales cycle length, quota attainment, forecast accuracy, and net revenue retention. Run a daily rep view, a weekly manager review, and a monthly CRO rollup. Lock definitions in your CRM before you do anything else.
Here is your seven-day checklist to get this running:
- Day 1: Freeze definitions for all seven metrics in a shared doc. Assign one owner per metric.
- Day 2: Audit your CRM stage gates. Make required fields mandatory at each stage transition.
- Day 3: Build a rep-level daily dashboard (pipeline, activity, next steps).
- Day 4: Build a manager weekly view (win rate, pipeline coverage, forecast vs. commit).
- Day 5: Build a CRO/board monthly view (quota attainment, NRR, average deal size, cycle length).
- Day 6: Run a data quality check. Flag any opportunity missing a close date, stage, or dollar value.
- Day 7: Hold a 30-minute team calibration. Walk through definitions. Get verbal buy-in.
Why these seven? They split roughly a majority of leading indicators such as pipeline coverage, activity, and forecast accuracy, with the remainder being lagging indicators including quota attainment, win rate, deal size, and cycle length. Research confirms a practical operating set runs 5–7 metrics, leaning toward leading indicators so you can act before the quarter closes. Leading metrics tell you what is coming. Lagging metrics tell you what happened. You need both, but if your dashboard skews lagging, you are always driving by looking in the rearview mirror.
Pro Tip: Write each metric definition in one sentence. If you cannot explain it in one sentence, the definition is not tight enough yet.
Key Takeaways
| Point | Details |
|---|---|
| Lock definitions first | Freeze every metric’s formula and CRM gate before building any dashboard or setting targets. |
| Use a majority leading/lagging split | Roughly 60% of your operating metrics should be leading indicators so you can act before the quarter closes. |
| Limit each dashboard view to 5–8 metrics | Reps, managers, and CROs each need a separate view tied to the decisions they actually make. |
| KPI patterns signal hiring gaps | Sustained ramp misses, low win rate by segment, and forecast inaccuracy over two quarters often point to a leadership gap, not a coaching gap. |
| Cornerstonesearch closes the talent gap fast | With 1,200+ placements and a 21-day average search timeline, Cornerstonesearch is the call to make when KPI drift points to a hiring problem. |
Table of Contents
- What does a prioritized sales KPI library actually look like?
- How do you build a KPI template every metric needs?
- How do you collect data and build dashboards you will actually use?
- How do you set targets, quotas, and ramp plans that actually stick?
- How do managers use KPIs to coach reps and run better forecast calls?
- How do you roll out a KPI framework so it actually gets adopted?
- When should you act on a KPI, tweak it, or retire it?
- When does a KPI problem mean you need to hire, not coach?
- What a 30-year SaaS sales recruiter sees in broken KPI programs
- Cornerstone Search Associates fixes the talent gap behind your KPI problem
- Sources
What does a prioritized sales KPI library actually look like?
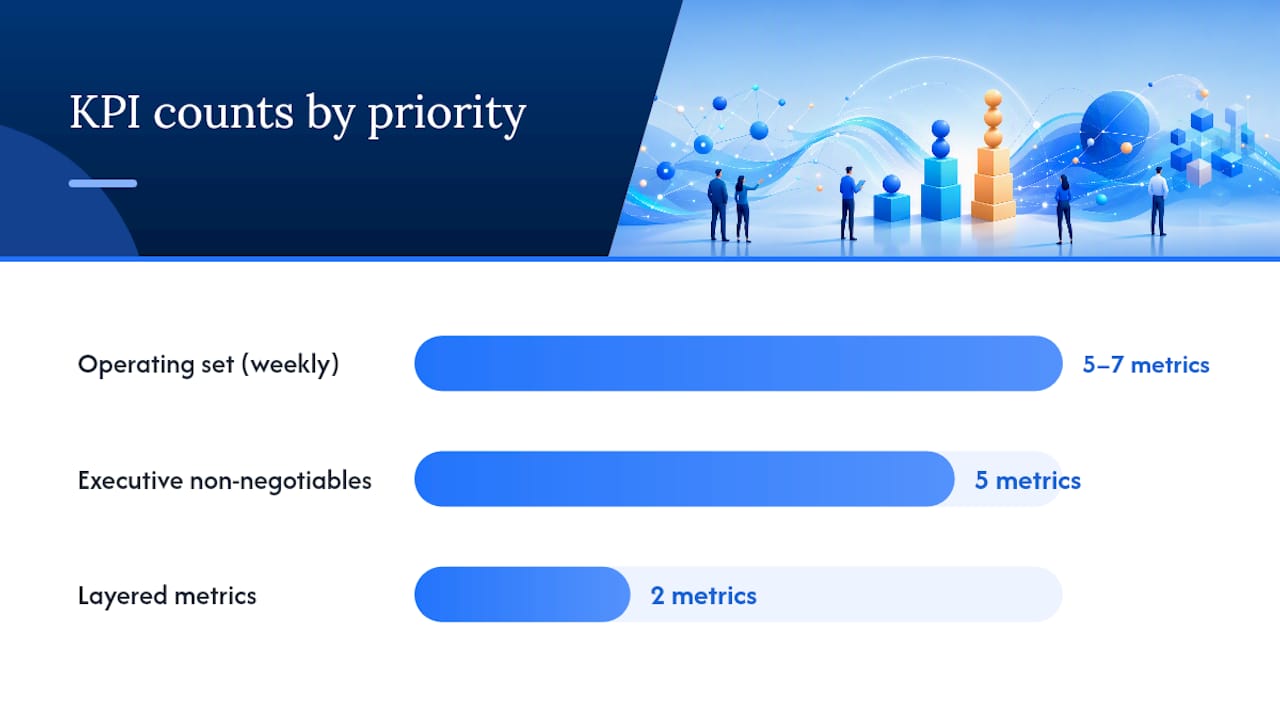
Most teams track too many numbers and act on too few. The fix is a two-layer system: an operating set of 5–7 metrics you review every week, and a deeper diagnostic layer you pull when something looks wrong. Insight Partners identifies the core problem clearly: teams focus only on outcomes, ignore future pipeline health, and track a disjointed set of KPIs. A combined leading/lagging framework with strict definitions fixes all three.
The table below covers the core KPI library for B2B SaaS sales teams. Benchmarks reflect typical ranges for North American SaaS; your actual targets will depend on segment, ACV, and selling motion.
The five non-negotiable executive metrics are pipeline coverage, average deal size, win rate, sales cycle length, and quota attainment. Build your CRO dashboard around those five first, then layer in forecast accuracy and NRR.
A few notes on role-level variants:
- SDRs should own MQL-to-SQL conversion, time to first meeting, and activity ratios (with quality checks, not just volume).
- AEs own win rate, average deal size, sales cycle length, and individual quota attainment.
- Managers own pipeline coverage, forecast accuracy, and ramp attainment for their team.
- CROs own quota attainment at the team level, NRR, average deal size trend, and forecast accuracy.
One more thing on pipeline coverage: it is the single most misread number on any dashboard. The right multiple is not a fixed folk rule. It depends on your win rate and how much of your pipeline is late-stage. Do the math for your motion before you set a coverage target.
How do you build a KPI template every metric needs?
Sloppy definitions are where KPI programs go to die. Two reps on the same team can report wildly different win rates if one counts every lead as an opportunity and the other only counts SQLs. Harvard Business Review makes the point plainly: measurement only helps when metrics map to behaviors you can manage and when definitions and ownership are clear. Without that, metrics create false confidence.
Every metric in your framework needs these fields locked down:
| Field | What to Specify |
|---|---|
| Metric Name | One canonical name, used everywhere (CRM, dashboard, 1:1 doc) |
| Precise Definition | One sentence. No ambiguity. |
| Formula | Written out with exact numerator and denominator |
| Measurement Gate | The fixed CRM stage where measurement starts and ends |
| Frequency | How often it is calculated (daily, weekly, monthly) |
| Owner | One person. Not a team. One person. |
| Data Source | CRM field name, billing system, or calendar integration |
| Dashboard Location | Which view it lives in (rep, manager, CRO) |
| Target | The number this metric should hit |
| Thresholds | Green / yellow / red bands for coaching triggers |
| Data Pitfalls | Common ways this metric gets inflated or gamed |
Filled example: win rate
Measuring win rate from a fixed gate, specifically from “qualified opportunity” to closed-won, is best practice for a reason. If you measure from “any lead ever touched,” your win rate looks great and means nothing.
Pro Tip: Name your metrics the same way in every system. If your CRM calls it “Opportunity Win Rate” and your dashboard calls it “Close Rate,” reps will assume they are different numbers and trust neither.
How do you collect data and build dashboards you will actually use?
A dashboard nobody checks is just a pretty spreadsheet. The goal is a decision tool, not a reporting artifact. Make the CRM the single source of truth and build every view from it. Stale spreadsheets driven by manual exports will always lag, always drift, and always cause arguments in the forecast call.
Dashboard views by audience
Limit each view to 5–8 metrics, each tied to a decision the viewer needs to make. More than eight and people stop reading it.
Daily rep view: Open pipeline count, next-step dates, activity logged today, deals with no activity in 7+ days.
Weekly manager view: Pipeline coverage by rep, win rate (rolling 90 days), forecast vs. commit, ramp attainment for new hires, deals stuck in stage for more than two weeks.
Monthly/quarterly CRO and board view: Quota attainment (team and individual), NRR, average deal size trend, sales cycle length trend, forecast accuracy for the prior period.
Monthly data quality check
Run this test every month before your CRO review:
- Count opportunities missing a close date. Target: zero.
- Count opportunities with no dollar value. Target: zero.
- Count opportunities that have not moved stages in 30+ days. Flag for review.
- Check win rate denominator: are SQLs being created consistently, or are reps skipping the stage?
- Verify forecast commit totals match CRM pipeline. Any gap means someone is working off a spreadsheet.
Forecast accuracy for high-performing teams runs at ±5%–10% variance between commit and actual close.
Pro Tip: Set a required field rule in your CRM: no opportunity advances past “Discovery” without a close date, a dollar value, and a next step. This one change eliminates most forecast surprises.
How do you set targets, quotas, and ramp plans that actually stick?
Quota math is where most sales leaders get sloppy; using the right boekhoudsoftware voor wervingsbureaus can help ensure accuracy in quota and revenue calculations. That is not a quota. It is a wish.
Here is the math that actually works for B2B SaaS:
Quota by rep: the formula
- Start with your revenue target for the period.
- Divide by the number of productive AEs (exclude reps still in ramp).
- Adjust for win rate: if your win rate is 25% and your average deal size is $40,000, each AE needs to close roughly four deals per quarter to hit $160,000.
- Back into pipeline coverage: at 3x coverage, each AE needs $480,000 in qualified pipeline per quarter.
- Check territory sizing: does the territory actually contain enough addressable accounts to generate that pipeline?
If the territory math does not work, the quota does not work. No amount of coaching fixes a quota set against an underpowered territory. For current SaaS quota benchmarks and calibration guidance, check the data before you finalize your plan.
Ramp targets and quota relief
New AEs need a ramp schedule, not a full quota from day one. A reasonable B2B SaaS ramp looks like this:
- Month 1: 0% of full quota. Focus on product knowledge, CRM setup, and first discovery calls.
- Month 2: 25%–33% of full quota. First pipeline building, first demos.
- Month 3: 50%–66% of full quota. First closes expected.
- Month 4: 75%–85% of full quota. Approaching full productivity.
- Month 5+: 100% of full quota.
Quota relief rules matter when the selling motion changes. If you reposition the product, change pricing, or enter a new segment mid-year, reps in affected territories deserve a quota reset or a temporary relief period. Holding reps to a quota built on a product that no longer exists is a fast way to lose your best people.
Calibration checklist with finance and GTM
- Align quota math with finance’s revenue model before you communicate targets to reps.
- Confirm pipeline coverage assumptions with RevOps (what win rate are you modeling?).
- Segment quotas by territory, product line, and customer type. A rep selling into enterprise needs different math than one selling SMB.
- Review how SaaS pricing changes affect quota and hiring needs before finalizing targets for any new product tier.
- Set a quota review trigger: if more than 30% of reps miss quota two quarters in a row, the quota is wrong, not the reps.
How do managers use KPIs to coach reps and run better forecast calls?
KPIs are only useful if they change what a manager does on Monday morning. If you are pulling numbers and not changing your coaching agenda, you are doing reporting, not management.
What to inspect in a 1:1
The KPI view tells you where to look. The 1:1 is where you find out why.
| KPI Signal | What to Inspect | Coaching Trigger |
|---|---|---|
| Win rate below threshold | Stage-by-stage conversion. Where are deals dying? | Objection handling, demo quality, qualification rigor |
| Pipeline coverage below 3x | New opportunity creation rate. Is the rep prospecting? | Prospecting activity, ICP targeting, outreach quality |
| Average deal size shrinking | Deal composition. Is the rep discounting or selling down? | Negotiation skills, multi-threading, champion building |
| Sales cycle lengthening | Stage duration. Where is time being lost? | Mutual action plans, executive access, procurement navigation |
| Forecast accuracy below ±15% | Commit discipline. Is the rep sandbagging or over-committing? | Deal inspection, close plan quality, next-step specificity |
| Ramp attainment below 50% in month 3 | Onboarding gaps. Is the rep getting enough support? | Enablement quality, manager time investment, territory fit |
Activity metrics work as diagnostic guardrails only when paired with quality checks. A rep logging 80 calls a week but converting none of them is not a high performer. They are burning the list.
Coaching 1:1 playbook
Run every 1:1 with these artifacts in front of you:
- Rep’s pipeline view filtered to current quarter (sorted by close date).
- Win rate and average deal size for the rolling 90 days.
- Last week’s activity log.
- Three deals the rep wants to discuss.
Work through each deal with a close plan question: “What is the specific next step, who owns it, and what is the date?” If the rep cannot answer all three, the deal is not in the forecast.
Forecast review meeting playbook
Required artifacts: CRM pipeline export (current quarter, sorted by stage and close date), prior period forecast accuracy, rep-by-rep commit totals.
Escalation rule: Any deal in the forecast with no activity in 14+ days gets pulled from commit until the rep can show a live next step.
Pro Tip: Run your forecast call with a simple rule: reps can only commit a deal if they can name the economic buyer, the decision date, and the next mutual action. Binary optimism (“it feels good”) is not a commit.
KPIs also tell you when a coaching problem is actually a hiring problem. You are looking at a fit gap. More on that below.
How do you roll out a KPI framework so it actually gets adopted?
The best KPI framework in the world fails if reps think it is surveillance and managers think it is extra work. Rollout is a change management problem, not a technical one.
Rollout checklist with milestones
- Definition freeze (Week 1): All metrics defined, formulas locked, owners assigned. No changes after this point without a formal review.
- CRM gate setup (Week 2): Required fields enforced at each stage. Data quality baseline measured.
- Training (Week 3): Every rep and manager walks through the dashboard. Definitions explained. Questions answered live.
- Pilot (Weeks 4–5): Run the framework with one team or one region. Collect feedback. Fix data issues.
- Full rollout (Week 6): All teams on the framework. Daily and weekly views live.
- Adoption review (Week 8): Check dashboard usage, data completeness, and weekly review attendance.
Stakeholder map
- CRO/VP Sales: Signs off on metric selection and targets. Owns the board-level view.
- Sales Operations: Owns CRM configuration, data quality, and dashboard builds.
- Finance: Validates quota math and aligns on revenue model assumptions.
- Enablement: Owns rep and manager training on metric definitions and dashboard use.
- Individual managers: Own weekly review cadence and 1:1 coaching against KPIs.
- Reps: Own their own data hygiene (stage updates, close dates, dollar values).
Adoption metrics and early warning flags
Track these to know if the rollout is working:
- Dashboard login rate by role (target: 80%+ of managers checking weekly).
- Data completeness score (target: 95%+ of open opportunities with required fields populated).
- Weekly review attendance rate (target: 100% of managers running a weekly pipeline review).
- Number of opportunities with no activity in 14+ days (flag for manager attention).
Fix the simplest one first.
When should you act on a KPI, tweak it, or retire it?
KPIs are not permanent. A metric that was useful when you were selling SMB at $10K ACV may be useless when you move upmarket to $100K enterprise deals. Build a review calendar and stick to it.
Review calendar
- Daily: Reps check their own pipeline view. No formal meeting.
- Weekly: Manager reviews team pipeline, coverage, and forecast with each rep.
- Monthly: CRO reviews quota attainment, NRR, average deal size, and cycle length trends. Sales Ops reviews data quality.
- Quarterly: Full framework review. Are the metrics still tied to the decisions we need to make? Are targets still calibrated to the business model?
- Annually: Metric retirement review. Pull the diagnostic layer. Retire anything that has not driven a coaching action in 12 months.
Decision rules: tweak vs. retire
Tweak a metric when:
- The definition has drifted (reps are interpreting it differently).
- The target is no longer calibrated to the current selling motion.
- The data source has changed and the formula needs updating.
Retire a metric when:
- It has not triggered a coaching action in two or more quarters.
- It is redundant with another metric already on the dashboard.
- The selling motion it was designed to measure no longer exists.
- It is being gamed consistently and the gaming behavior is harder to fix than the metric is worth.
Retiring a metric: the short process
- Document the retirement decision in the metric definition doc (reason, date, owner).
- Archive the historical data. Do not delete it.
- Communicate the change to all users in the next weekly review meeting.
- Remove the metric from the dashboard within 48 hours of the decision. Leaving dead metrics on a dashboard trains people to ignore the whole thing.
KPI stacks that include outcomes, leading indicators, and quality checks prevent gaming and keep coaching aligned to real customer outcomes. When you retire a metric, replace it with something that serves the same function more honestly.
When does a KPI problem mean you need to hire, not coach?
Some KPI patterns are coaching problems. Others are hiring problems. Knowing the difference saves you six months of wasted 1:1s and a lot of rep turnover.
Hire-signal checklist
These KPI patterns, sustained over two or more quarters, point to a leadership or talent gap rather than a process issue:
- Consistent ramp misses across multiple new hires: If three consecutive AEs miss ramp targets, the problem is not the reps. It is the hiring profile, the onboarding, or the manager.
- Persistent low win rate by segment: A team-wide win rate below 15% in a segment where competitors are winning suggests either a product fit problem or a sales leadership gap.
- Dramatic drop in average deal size: If ACV is shrinking quarter over quarter without a pricing change, reps are discounting to close or selling to the wrong buyers. A VP of Sales who cannot stop this trend is a leadership problem.
- Repeated forecast inaccuracies: A manager whose forecast is off by ±25% or more every quarter is not inspecting deals. That is a management skill gap.
- Stalled pipeline velocity across the whole team: If cycle length is growing and no single rep is the outlier, the issue is often the sales process or the person running it.
When KPI drift points to a leadership gap, the fastest fix is usually a leadership hire. Cornerstone Search Associates has placed over 1,200 sales professionals since 1996, with an average search from kickoff to offer acceptance of 21 days. That speed matters when a broken KPI trend is costing you pipeline every week. If your dashboard is showing persistent ramp misses, a win rate that will not move, or a forecast you cannot trust, those are signals worth acting on before another quarter closes.
For a practical framework on benchmarking executive sales talent against the role you actually need to fill, that resource walks through the process clearly.
One pattern worth calling out: a VP of Sales who is great at managing individual contributors but cannot build a repeatable process will show up in your KPIs as a team-wide coaching problem. Win rates are inconsistent across reps. Pipeline coverage varies wildly by territory. Forecast accuracy is low. None of these look like a single rep issue. They look like a system issue. And the system is usually the leader.
When you decide a hire is the right move, validating candidate claims against real performance data is the step most hiring managers skip. Do not skip it.
What a 30-year SaaS sales recruiter sees in broken KPI programs
Most KPI programs fail for the same three reasons. I have seen all of them, repeatedly, across 30 years of placing SaaS sales talent.
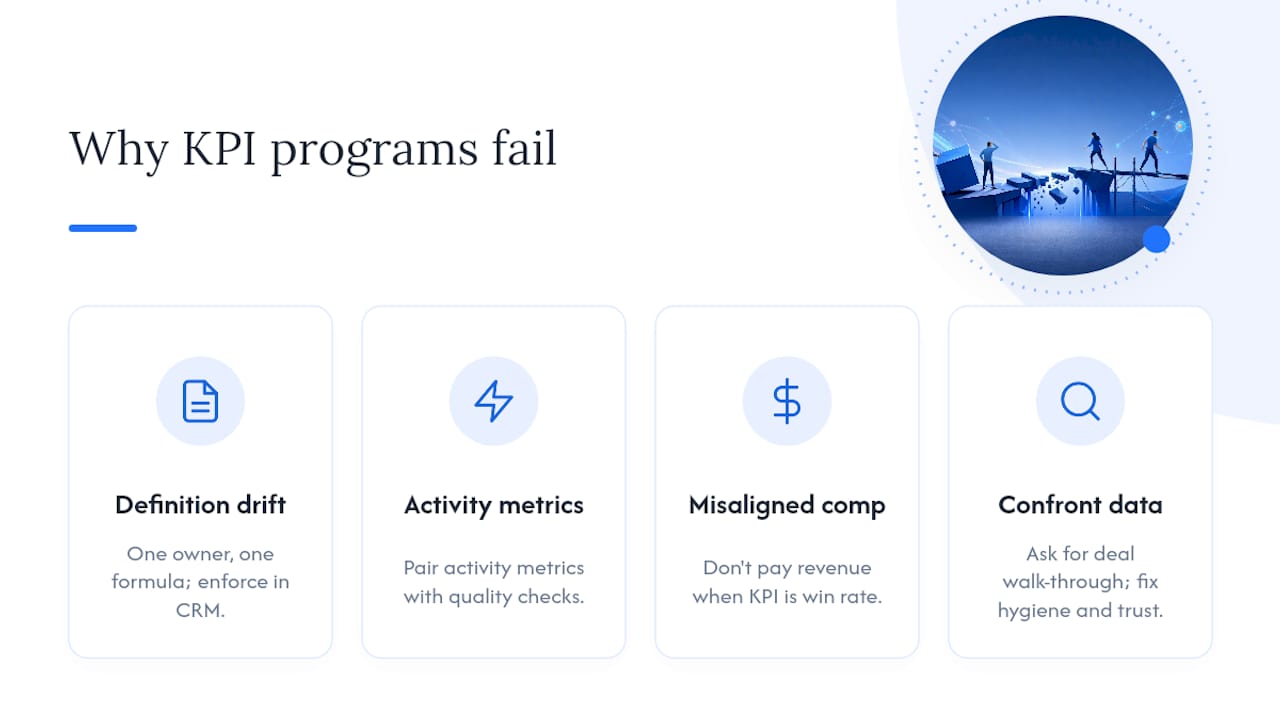
The first is definition drift. A team launches a KPI framework with clean definitions. Six months later, one manager is counting opportunities from first touch, another is counting from demo completed, and a third is counting from “verbal yes.” Now you have three different win rates on the same team and nobody trusts the number. The fix is not a better dashboard. It is a definition freeze with teeth: one owner, one formula, enforced in the CRM.
Calls logged, emails sent, meetings booked. All green. Revenue: red. Activity metrics without quality checks are a way of feeling busy while the pipeline empties. If you are tracking calls per day, also track conversion from call to meeting. If you are tracking meetings booked, also track meeting-to-opportunity conversion. Pair every activity metric with a quality check or pull it from the dashboard.
The third is misaligned comp. You cannot tell a rep their KPI is win rate and then pay them on total revenue closed. They will close anything, at any discount, to hit the revenue number. Comp drives behavior. KPIs should describe the behavior you want. When they do not match, reps are not gaming the system. They are following the incentive you built.
Here is how to confront bad data without losing the room. When a rep’s numbers look wrong, do not accuse. Ask: “Walk me through how this opportunity got to commit stage.” The answer tells you everything. If the rep cannot walk you through the deal, the deal is not real. If the data in the CRM does not match what the rep describes, you have a data hygiene problem and a trust problem. Fix both in the same conversation.
And when a rep is gaming metrics? Name it directly. “Your activity numbers are high but your conversion is the lowest on the team. I need to understand what is happening in those calls.” Specific, factual, no drama. That is the conversation.
Cornerstone Search Associates fixes the talent gap behind your KPI problem
When your KPI dashboard shows a pattern you cannot coach your way out of, the problem is usually the person in the seat, not the process on the whiteboard.
Cornerstonesearch specializes in SaaS sales recruiting for exactly this situation: a VP Sales seat that has been empty too long, an AE team missing ramp targets for two consecutive quarters, or a CRO hire that needs to close in weeks, not months. With over 1,200 placements since 1996 and an average search-to-offer timeline of 21 days, Cornerstonesearch moves fast when pipeline is bleeding.
Before you call, pull three things: your current KPI dashboard export, your open role spec (use the SaaS sales job description template if you need a starting point), and your most recent comp plan. Those three documents tell a recruiter everything needed to find the right candidate fast. Ready to close the gap? Start the conversation here.
Sources
The sources below informed this guide. Each one adds something specific.
- In sales, can you manage what you’re measuring? | Harvard Business Review
- The KPI Framework of a High-Performing Sales Organization
- Sales KPIs: most teams measure the wrong things
- Sales Metrics Dashboard: The 15 KPIs Every B2B Team Must — Gangly Blog
- Sales Metrics Dashboard: 15 Essential KPIs to Track | Revenue Velocity Lab